
Maths: Not Ofcom's strong suit?
 It seems that following the ESOA submission to Ofcom concerning the apparent errors in the RealWireless study on spectrum demand for mobile data reported by Wireless Waffle on 15 Febuary, the offending report has now been re-issued (note the publication date is now 11 April 2014) with the axis on Figure 44 which shows data traffic density re-labelled from 'PB/month/km˛' (PetaBytes) to 'TB/month/km˛' (TeraBytes), thereby reducing the calculated data traffic by a factor of 1000 and now making the document internally consistent. Well done Ofcom and RealWireless, though they could have publicly admitted the apparent error, instead of quietly re-issuing the document with no fanfare. Presumably this now makes ESOA look rather silly.
But... even a 10th grade student could complete the sum that is behind the ITU data forecasts and realise that the axis should have read 'PB' all along (and therefore that the internal inconsistencies are not fixed and that the data in the ITU and RealWireless models is still hundreds of times too large). Here, for you to try, are the values - taken from the ITU's 'Speculator' model - and the maths you need to apply. The values are for 'SC12 SE2' which represents people using 'high multimedia' services in urban offices and is with the ITU model in its 'low market' market setting (it has a higher one too).
| User density: | 120,975 users per km˛ |
| Session arrival rate per user: | 3.3 arrivals per hour per user |
| Mean service bit rate: | 13.83 Mbps |
| Average session duration: | 81 seconds per session |
Now for the maths...
- First, multiply the first two numbers to get 'sessions per hour per km˛'. (120,975 × 3.3 = 399,217.5)
- Then multiply this by the average session duration to get 'seconds of traffic per hour per km˛'. (399,217.5 × 81 = 32,336,617.5)
- Then multiply by the mean bit rate to get 'Megabits of traffic per hour per km˛'. (32,336,617.5 × 13.83 = 447,215,420)
- To make the numbers more managable, divide by 8 to get from bits to bytes, then by 1,000,000 to get from Megabytes to Terabytes (447,215,420 ÷ 8,000,000 = 55.9)
The number of days in a month is relatively easy to work out, it's 30.4 on average (365.25 ÷ 12). So monthly traffic per square km would be 559 × 30.4 = 16,994 TeraBytes per month per km˛.
 This is the monthly data for just one urban traffic type in the ITU model, there are 19 others. Ignoring the others completely, Figure 44 of the RealWireless report should show monthly traffic in urban areas for the ITU model being 17,000 TeraBytes per month per square km, include the other activities that urban office workers undertake and the value should be much higher still. But it now shows as being just over 100 TB/month/square km for the ITU and less for the RealWireless prediction, 100 or more times too low. Oh dear!
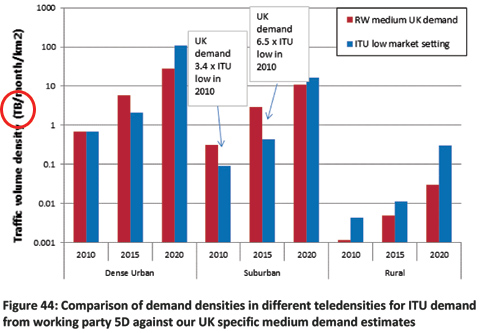
 So having corrected the figure in the RealWireless report, it is now wrong. It was correct before. And it still does not tally with the total data forecast for the UK that is in the same report.
Surely there are people at Ofcom who own a calculator, have a GCSE in maths, and possess a modicum of professionalism such that they would want to check the facts before blithely allowing their suppliers to fob them off with an 'oops, we mis-labelled an axis' argument. Presumably they thought that it was ESOA who couldn't handle a calculator properly.
Now who looks silly?
add comment
( 395 views )
| permalink
| 

 ( 2.8 / 1444 )
( 2.8 / 1444 )