
Summer Station Successes
With the summer Sporadic-E season now all but over, it's time to reflect on the achievements made. By my reckoning nearly 200 new logs have been added to the Wireless Waffle FM DX Logbook more than doubling the number previously recorded. Amongst these are 10 new countries: Austria, Czechia, Estonia, Finland, Hungary, Libya, Poland, Romania, Serbia and Slovakia. Reception of 'Dar Al-Iftaa' (also found online named as 'Dar Al-Ifta' and 'Ifta FM') from a transmitter site at Gharyan (a.k.a. Garyan) in Libya becoming my all time Sporadic-E distance record of 2435 km.
In another seasonal surprise, 18 August 2025 yielded some incredible Tropospheric propagation across the North Sea bringing in reception from Denmark (with full RDS being received) and Sweden, the latter coming in at 1146 km beating my former Tropo distance record of 675 km - almost twice as far. All these new logs have significantly fuelled the analysis of the different propagation modes which can be found on the logbook.

The original analysis chart (above) compares the signal that would be received based on simple free-space propagation loss for the various stations received. As of today it shows that the average 'received signal' for Tropospheric propagation is -51 dBm and for Sporadic-E is -67 dBm. This would suggest that Sporadic-E yields 16 dB lower path loss than for Tropospheric propagation, given that the threshold for reception of a signal is the same no matter what route it takes between transmitter and receiver.
You may note that some of the squares on the chart which represent a log entry have a pale grey square around them. This reflects the fact that the station's RDS was received. It takes at least 20 dB more signal for a receiver to decode RDS than it does just to hear the audio so the expectation was that the logs where RDS was successfully received would be clustered around those with the highest signal strength. For the Tropospheric logs this logic generally holds with the most RDS logs being those whose free-space signal would be over -46 dBm. For Sporadic-E however, the RDS from even some of the theoretically weakest stations was successfully received.
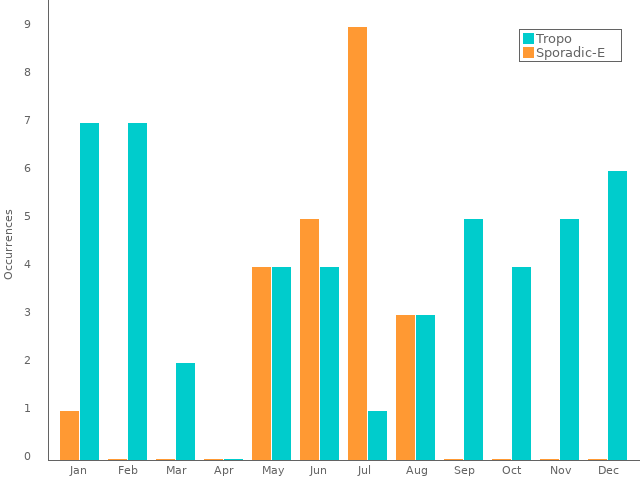
The second chart looks at the months in which different propagation modes occur. In general Tropospheric propagation is spread evenly across the whole year with Sporadic-E occurring in the summer months (primarily June, July and August) with a little spurt of activity in mid-winter (January). This supports generally perceived wisdom on the matter.
Two new charts have been added to the page. The first shows the distribution of logs across the FM band from 87.5 to 108.0 MHz with stations being grouped into blocks 1.7 MHz wide. Sporadic-E openings generally begin from low frequencies and work their way up the band, occasionally reaching well above the FM band and impacting the 2m amateur band (144 MHz). This analysis clearly shows that the reception of Sporadic-E signals is much more prevalent at the bottom of the FM band, whereas in general the likelihood of Tropospheric propagation is relatively equal across the whole band.

It may look as if there is less reception of Tropospheric signals in the top 'block' between 106.2 and 108.0 MHz. However, it is worth noting that in most European countries, the power levels of stations in this frequency range (especially above 107 MHz) is limited so as to try and avoid causing unwanted interference to aeronautical radio services which occupy the territory above 108 MHz. It is therefore more difficult to catch DX stations above 107 MHz as their power levels are lower and this is most likely why this frequency range appears to have fewer logs than others.

The final new chart plots the frequency on which a station has been received against its distance. The idea was to discover whether there is any correlation between the two. For the Tropospheric logs where the average distance is 292 km, the line-of-best fit which is also shown on the chart tilts slightly down at higher frequencies but is otherwise quite flat suggesting that propagation right across the FM band is pretty evenly spread (noting the earlier comment about the transmitter power of stations above 107 MHz). For Sporadic-E propagation where the average distance is 1554 km, there does seem to be a slight tilt downwards at higher frequencies however as there are fewer logs at higher frequencies, this could account for this difference. Also, it is clear that the spread of distances shown in the logs is significant so trying to a 'best fit' line may have less relevance. In general and subject to even more data, there's nothing that is yet totally conclusive when it comes to Sporadic-E propagation providing reception of more distant stations at lower frequencies.
In another seasonal surprise, 18 August 2025 yielded some incredible Tropospheric propagation across the North Sea bringing in reception from Denmark (with full RDS being received) and Sweden, the latter coming in at 1146 km beating my former Tropo distance record of 675 km - almost twice as far. All these new logs have significantly fuelled the analysis of the different propagation modes which can be found on the logbook.

The original analysis chart (above) compares the signal that would be received based on simple free-space propagation loss for the various stations received. As of today it shows that the average 'received signal' for Tropospheric propagation is -51 dBm and for Sporadic-E is -67 dBm. This would suggest that Sporadic-E yields 16 dB lower path loss than for Tropospheric propagation, given that the threshold for reception of a signal is the same no matter what route it takes between transmitter and receiver.
You may note that some of the squares on the chart which represent a log entry have a pale grey square around them. This reflects the fact that the station's RDS was received. It takes at least 20 dB more signal for a receiver to decode RDS than it does just to hear the audio so the expectation was that the logs where RDS was successfully received would be clustered around those with the highest signal strength. For the Tropospheric logs this logic generally holds with the most RDS logs being those whose free-space signal would be over -46 dBm. For Sporadic-E however, the RDS from even some of the theoretically weakest stations was successfully received.

The second chart looks at the months in which different propagation modes occur. In general Tropospheric propagation is spread evenly across the whole year with Sporadic-E occurring in the summer months (primarily June, July and August) with a little spurt of activity in mid-winter (January). This supports generally perceived wisdom on the matter.
Two new charts have been added to the page. The first shows the distribution of logs across the FM band from 87.5 to 108.0 MHz with stations being grouped into blocks 1.7 MHz wide. Sporadic-E openings generally begin from low frequencies and work their way up the band, occasionally reaching well above the FM band and impacting the 2m amateur band (144 MHz). This analysis clearly shows that the reception of Sporadic-E signals is much more prevalent at the bottom of the FM band, whereas in general the likelihood of Tropospheric propagation is relatively equal across the whole band.

It may look as if there is less reception of Tropospheric signals in the top 'block' between 106.2 and 108.0 MHz. However, it is worth noting that in most European countries, the power levels of stations in this frequency range (especially above 107 MHz) is limited so as to try and avoid causing unwanted interference to aeronautical radio services which occupy the territory above 108 MHz. It is therefore more difficult to catch DX stations above 107 MHz as their power levels are lower and this is most likely why this frequency range appears to have fewer logs than others.

The final new chart plots the frequency on which a station has been received against its distance. The idea was to discover whether there is any correlation between the two. For the Tropospheric logs where the average distance is 292 km, the line-of-best fit which is also shown on the chart tilts slightly down at higher frequencies but is otherwise quite flat suggesting that propagation right across the FM band is pretty evenly spread (noting the earlier comment about the transmitter power of stations above 107 MHz). For Sporadic-E propagation where the average distance is 1554 km, there does seem to be a slight tilt downwards at higher frequencies however as there are fewer logs at higher frequencies, this could account for this difference. Also, it is clear that the spread of distances shown in the logs is significant so trying to a 'best fit' line may have less relevance. In general and subject to even more data, there's nothing that is yet totally conclusive when it comes to Sporadic-E propagation providing reception of more distant stations at lower frequencies.
add comment
( 1014 views )
| permalink
| 
 ( 3.1 / 2144 )